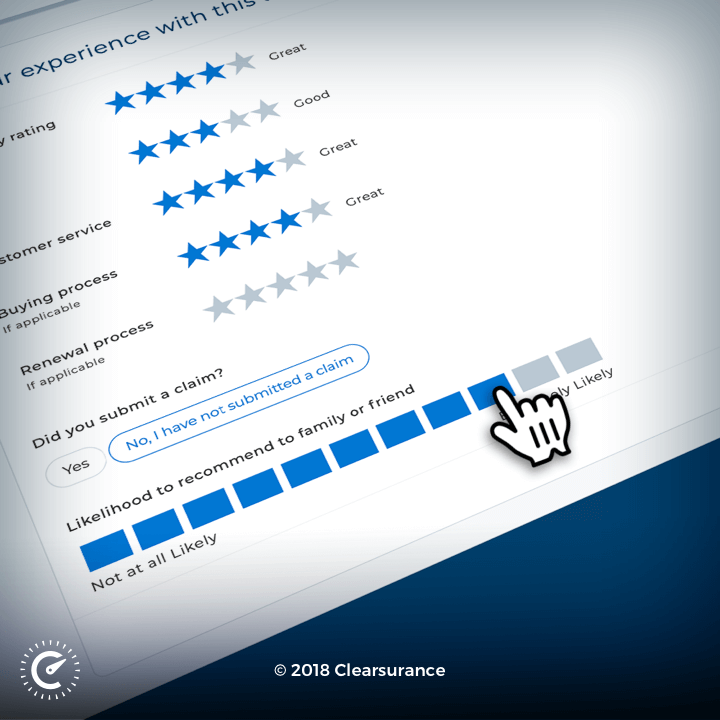
The Net Promoter Score® has long been viewed in the insurance industry as a reliable measure of policyholder loyalty. The appeal is the simple nature of the question...one question asking consumers their likelihood of recommending a specific brand. The method for administering the NPS is left up to the individual companies.
Since companies self-administer, and in essence survey themselves, the application of NPS methodology can be somewhat opaque and inconsistent across the insurance industry.
Clearsurance has collected over 125,000 insurance carrier reviews since 2017 by asking the NPS question in the same exact way at truly random touchpoints in the insurance customer journey. Each policyholder leaving a review is asked the NPS question of how likely they are to recommend their insurer. There is no selection process. Simply said everyone is asked and required to publish a review and rating. Our consistent method allows for a more reliable and unbiased representation of consumer sentiment.
Below, you'll find comparable Net Promoter Scores for auto and homeowners insurance companies. Additionally, we are providing insights into the key drivers of the scores based on ratings and the 100,000+ comments, where we have mined the unstructured text data that policyholders have provided.
What is a Net Promoter Score and what's a good NPS Score?
Respondents to the Net Promoter Score questioned are grouped into one of three categories, depending on their response.
- Promoters (score 9-10): These are considered loyal enthusiasts — customers who may encourage others to join the company
- Passives (score 7-8): These customers are considered satisfied with the company but aren't enthusiastic and may be susceptible to leaving for a competitor
- Detractors (score 0-6): These are considered unhappy customers who may spread negative word-of-mouth about the company
The Net Promoter Score of a company can range from 100 (all respondents are promoters) all the way to -100 (all respondents are detractors). Based on global NPS standards, scores better than 0 are considered good, scores higher than 50 are considered excellent and scores above 70 are considered world-class.
What's considered a good NPS does vary to some degree by industry. The average NPS in the auto insurance industry is 44 while the average in the homeowners insurance industry is 42, according to NICE Satmetrix.
Insurance Net Promoter Scores
Only car and home insurers with at least 150 customer reviews were included in our ranking list, resulting in a ranking of 35 car and 18 homeowners insurance companies.
NPS for car insurance companies
NPS for homeowners insurance companies
| Homeowners insurance company |
NPS® |
# of reviews |
NPS rating |
|---|---|---|---|
| USAA | 77% | 1,296 | World class |
| Country Financial | 58% | 175 | Excellent |
| Erie Insurance Group | 58% | 543 | Excellent |
| Amica Mutual Insurance Company | 54% | 268 | Excellent |
| AAA | 45% | 569 | Good |
| The Hartford | 44% | 271 | Good |
| Geico Insurance Company | 41% | 1,233 | Good |
| State Farm Insurance | 40% | 4,482 | Good |
| Liberty Mutual Insurance | 38% | 1,019 | Good |
| Progressive Corporation | 38% | 936 | Good |
| Safeco Insurance | 37% | 293 | Good |
| Farmers Insurance Group | 35% | 1,064 | Good |
| MetLife, Inc. | 33% | 336 | Good |
| Travelers Companies, Inc. | 32% | 564 | Good |
| Allstate Insurance | 32% | 3,397 | Good |
| Farm Bureau Property & Casualty Insurance Company (FBPCIC) | 29% | 257 | Good |
| Nationwide | 29% | 782 | Good |
| American Family Insurance | 28% | 757 | Good |
Several factors can influence a company’s score. While it’s not the focus of this report to determine the driving factor for each company, we did look at the results in aggregate in order to uncover a few insights.
1. Having a claim itself is not a strong indicator; it’s how the claim service is rated that matters
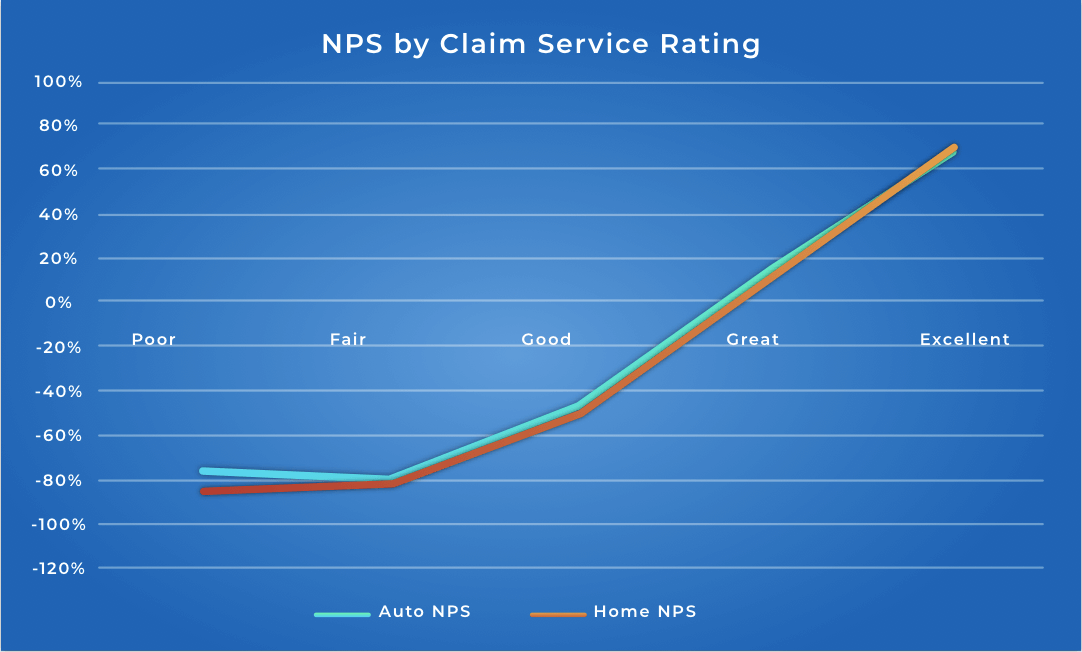
Comparing NPS for those who experienced a claim vs. those who did not resulted in only a slight difference. Contrary to what one might think, those who had a claim actually averaged a higher NPS. This is likely due to the fact most individuals have a positive claim experience. In fact, the more glaring impact can be seen when comparing NPS by how individuals rated their claims experience. Analyzing the over 26,000 ratings for claims experience showed a significant trend. As the rating for claim service improves, so does the NPS.
| Auto NPS® | Home NPS® | |
|---|---|---|
| Had a claim | 68% | 69% |
| Did not have a claim | 63% | 64% |

2. Policies in the duration of 1-5 years (auto) and 6-10 years (home) are the most at risk
Clearsurance was able to access nearly 50,000 reviews where a policyholder provided detailed information about the length of time they have owned a policy with their carrier. According to the data, the risk of a policy lapsing will vary based on years of policy duration.
| Auto NPS® | Home NPS® | |
|---|---|---|
| <1 year | 31.3% | 36.0% |
| 1-5 years | 27.9% | 30.9% |
| 6-10 years | 39.2% | 28.9% |
| 10+ | 51.8% | 42.1% |
3. Multiple factors influence a score; however poor claim service has the biggest impact on NPS
Net Promoter Score is calculated by segmenting individuals into either promoters or detractors. In looking at the unstructured text data, comments provided by these two segments provides an understanding of how their experiences differ, and what might be driving feedback. As detailed in the table below, promoters are significantly more likely to use positive words to describe their experience (i.e. speed, helpful and ease). It’s important to note that the frequency of mentions for rate increase saw the greatest deviation; however, it’s the reviewers referencing a “poor” claims experience that had the most significant and predictable impact relative to the NPS...which gets us back to our first insight above.
Auto insurance comments from unstructured text data found in customer reviews
| Detractors | Promoters | |
|---|---|---|
| Rate Increase | 17% | 3% |
| Helpful | 7% | 18% |
| Miscommunication/expectation | 6% | 1% |
| Speed | 6% | 18% |
| Ease | 6% | 16% |
| Claim Dispute | 5% | 0% |
| Slow Claim | 2% | 0% |
Homeowners insurance comments from unstructured text data found in customer reviews
| Detractors | Promoters | |
|---|---|---|
| Rate Increase | 14% | 2% |
| Claim Dispute | 8% | 0% |
| Helpful | 7% | 17% |
| Miscommunication/expectation | 6% | 1% |
| Speed | 6% | 19% |
| Ease | 5% | 14% |
| Slow Claim | 2% | 0% |
Interested in engaging more with Clearsurance? Learn more about our offerings here.
Net Promoter, Net Promoter System, Net Promoter Score, NPS, and the NPS-related emoticons are registered trademarks of Bain & Company, Inc., Fred Reichheld, and Satmetrix Systems, Inc.
The content on this site is offered only as a public service to the web community and does not constitute solicitation or provision of legal advice. This site should not be used as a substitute for obtaining legal advice from an insurance company or an attorney licensed or authorized to practice in your jurisdiction. You should always consult a suitably qualified attorney regarding any specific legal problem or matter. The comments and opinions expressed on this site are of the individual author and may not reflect the opinions of the insurance company or any individual attorney.


